The Insights area can be accessed from the profile menu by all ahead editors and admins. It is divided into three tabs: overall usage, content and news. While you can view insights from custom time periods in the news tab, the overall usage and content tabs always show you data from the last week.
Overall Usage
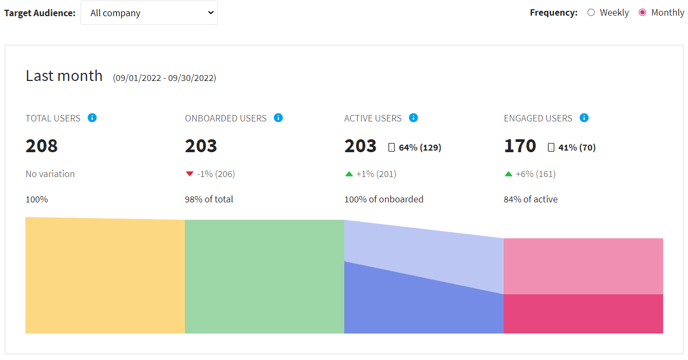
In this tab you can see an overview of the usage of ahead by your users, either the whole company or by target audience. You can view the data from the last week or last month.
- Total users: total number of users in your organisation that can access ahead
- Onboarded users: users that logged in to ahead at least once, ever
- Active users: users that have used ahead at least once in the selected period
- Engaged users: users that have interacted with content once over the selected period
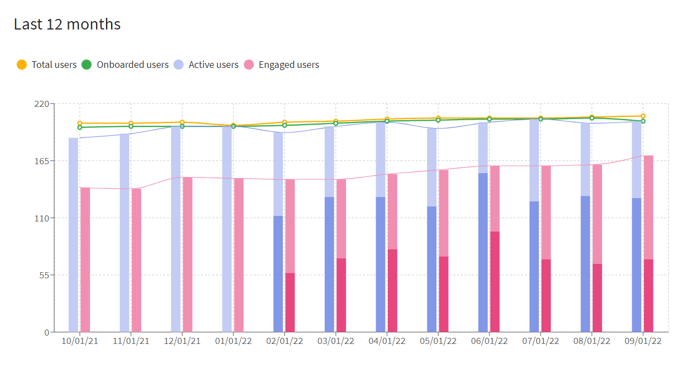
Below the overview of last week (or last month) you can find a graph with a trend line over the last 12 weeks or last 12 months, depending if you've selected the weekly or monthly frequency respectively.
Content
The content tab gives you an overview of content published in the given period. It includes overall contribution by users and published content, as well as a breakdown of published content by type.
News
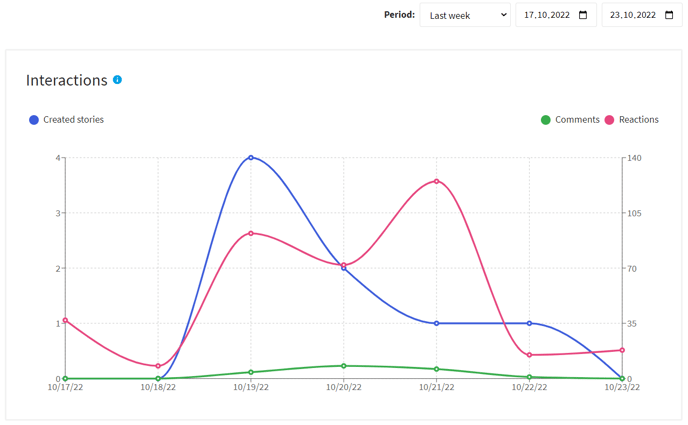
In this tab you can see an overview of news published in a period of time of your choosing. You can choose one of the predefined periods (last week, last month or last quarter) or input a custom period.
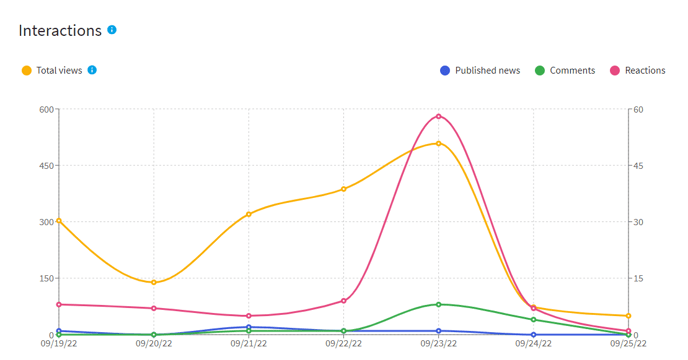
The Interactions chart shows the interactions with news published during the selected period. To improve data visualization the "Total views" uses the axis on the left, while "Published news", "Comments" and "Reactions" use the axis on the right.
Below the chart you see a table of news published in the selected period, with relevant information such as coverage, visitors (unique views), interactions (comments and reactions) and whether the news was targeted.
You can sort the table by different properties and export it to Excel. The Excel Report contains additional details about the news.
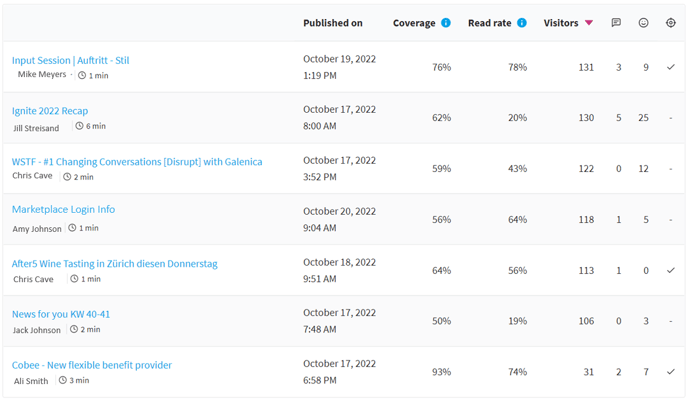
💡 Coverage indicates what percentage of the target audience has visited the news. A 100% coverage means that you have successfully reached the entire intended audience.
🎓 Learn more about the read rate.
Stories
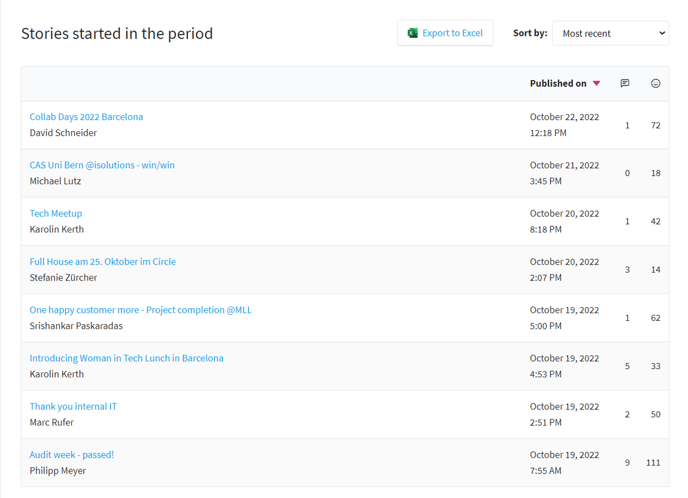
In the Stories tab you can see data related to the stories published. Similar to the News insights, you can choose a specific time period: last week, last month, last quarter or a customer period of your choosing.
This tab also includes an interactions chart, showing the reactions and comments on stories created in the selected period, as well as a table of all the stories created in the period.
You can also export the table to Excel, where you will find more information, like the different elements used in your stories (images, videos, thoughts and company compass links).